Real-time Sensor Visualisation
This is the website presents SensorVis, the software developed in the diploma thesis Visualising Interpolations of Dynamic Phenomena Observed by Mobile Sensors by Daniel Nüst.
The software is available as Open Source in the Sensor Web Community at 52°North, see https://wiki.52north.org/bin/view/Sensornet/SensorVis. This page will not be updated anymore.
The Project
- Problem
- Technological advances allow us to use unmanned aerial vehicles (UAV) to observe my different kinds of phenomena for example for observing plumes of pollutants in disaster scenarios. In those cases the phenomenon changes dynamically and up to date information is crucial. However, the spatio-temporal variability of the data is rarely modelled and processing of the data does not yet
- Idea
- As a first step we suggest using methods based on computer graphics and geovisualisation to present the sensor platform's movement history together with the processed data, in this case interpolations, to increase the understanding of the data that the process output is based on und eventually better understand the observed property.
- Solution
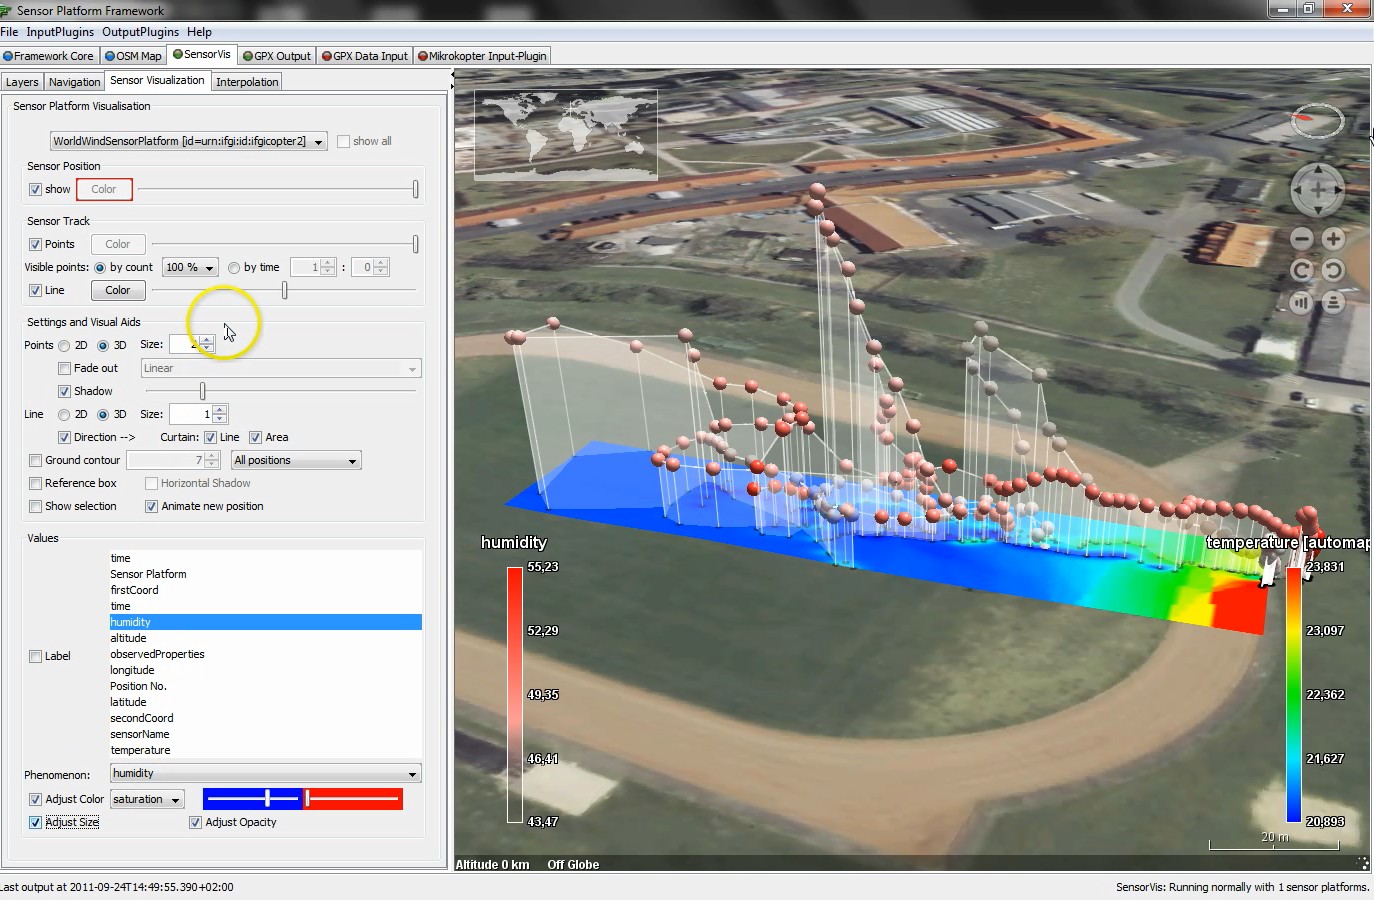
SensorVis provides adapted visualisation of the sensor with specific techniques to help users understand the input data. These techniques are implemented in a 3D virtual globe environment based on NASA World Wind. The interpolation processing is outsourced to INTAMAP. The software runs as a SPF plugin. In a highly interactive environment a user can explore real-time observations with different methods and calculate interpolations using any subset of observations.

Screenshot of SensorVisDownload video file (mp4, 1080p, 296 MB)
About
Daniel is a student in Geoinformatics with the Institute for Geoinformatics ifgi at the University of Muenster. Please see his profile page for contact details or contact him directly via .